Camel Monitor Operator 1.0.0 release
We’re pleased to announce the availability of Camel Monitor operator version 1.0.0. This is the first stable release of the project and we’re happy to announce its general availability with a lot of new great features to help you monitor your Camel workloads on Kubernetes and Openshift.
From this version onward we’re including the Camel Dashboard plugin as part of the installation procedure when this is running in OLM (the preferred method for Openshift).
Embedded Camel Dashboard plugin on Openshift
The Camel Dashboard plugin is a nice way to provide a view of the monitored fleet of Camel applications running on the cluster. It’s based on the Openshift plugin extension, therefore it will be installed only when the operator detects the cluster type as Openshift.
The new version is reflecting the changes and the new feature available in the last release. Here a quick overview of the main list page:
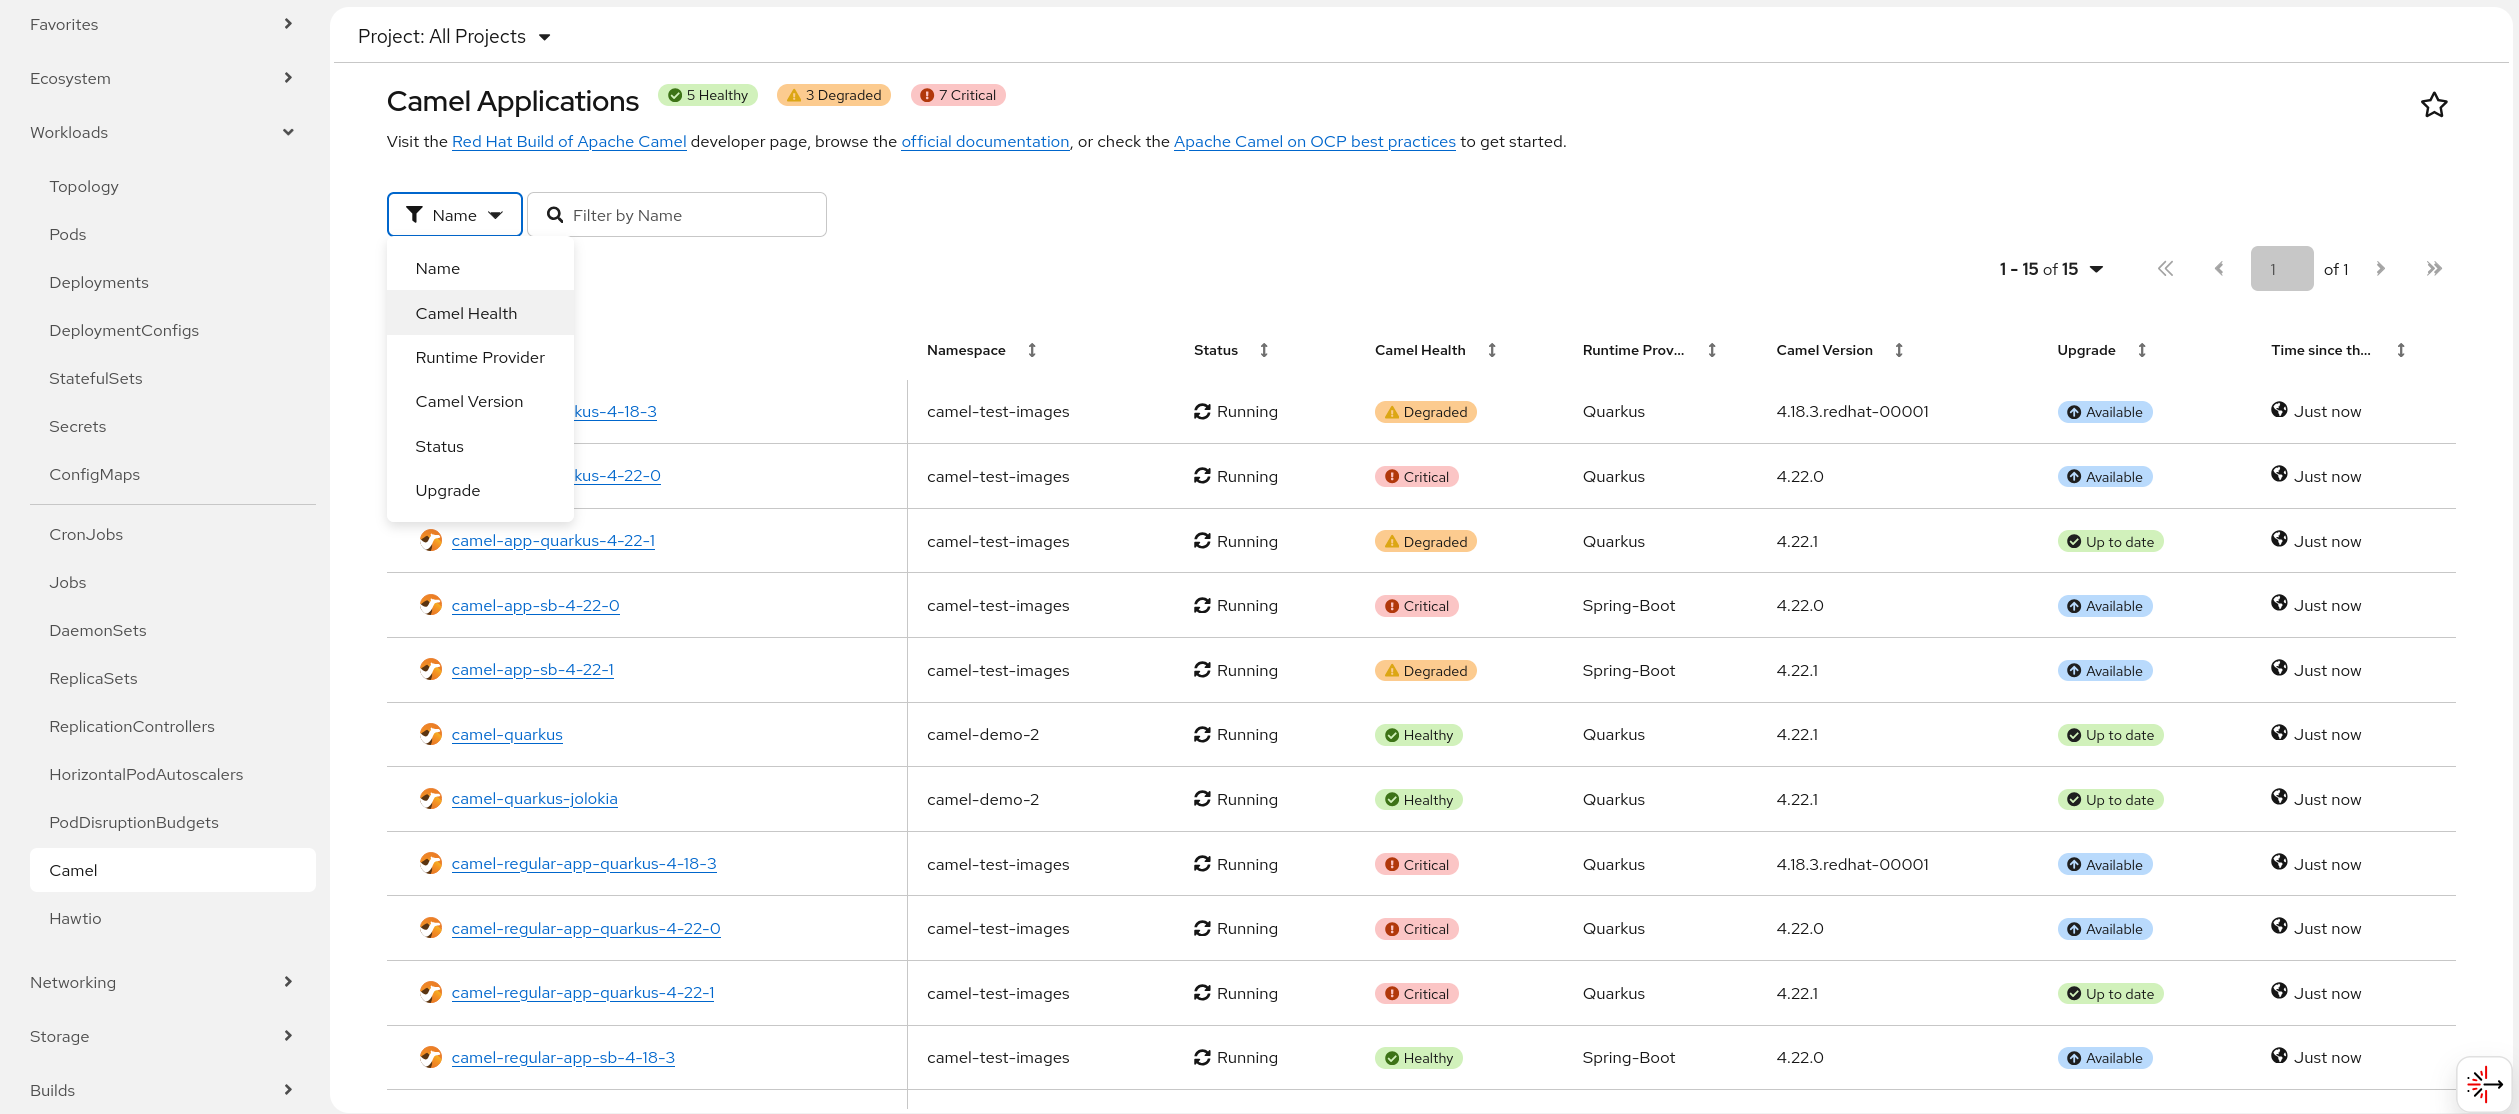
If you’re installing it via OLM, the bundle will include the configuration required to execute the plugin automatically. We were supporting the plugin even in previous versions, but it required a separate installation procedure.
For the other installation procedures (Helm and Kustomize), then you just need to provide an environment variable OPENSHIFT_CONSOLE_PLUGIN_IMAGE set to quay.io/camel-tooling/camel-dashboard-console:1.0.0.
Configure health and metrics ports and endpoints
In this version we’re enabling the possibility to configure the health and metrics endpoints for each application. Previously we were expecting health and endpoints to be available on the same port and we have made this configuration more flexible by enabling the separation of each metrics and health port and endpoint location.
Conventional Quarkus and Spring Boot endpoints support
Another new feature is the possibility for the operator to automatically scrape information from the conventional Quarkus or Spring Boot runtimes default and without the requirement to have the camel-observability-services installed. We still need the health and metrics exposed, but from this version onward, they can be left in the default which may be different in each runtime.
For example Quarkus default when you’re not using camel-observability-services has a /q base path, whilst Spring Boot has /actuator. So, either you use the default camel convention (still preferred), the runtime convention or your special configuration, the Camel Monitor Operator will be able to monitor the health of your Camel applications.
Detect runtime version upgrade
When you’re running large fleet of Camel applications, one of the question you may ask is if they are all up to date. The Camel Monitor operator will check that for you. We’ve added a check to verify if the Maven repository has a new release of your Camel application (core, Quarkus or Spring Boot) and you can monitor a new condition available on each CamelMonitor. Also the GUI will be of help, highlighting that when a new Camel release is available.