Architecture
The Camel Dashboard project is composed by several components that cooperate to let the user have a smooth monitoring experience, flexible enough to fit any kind of Camel application CICD strategy. Whether you deploy via Camel K or any other CICD technology, the monitor experience will be the same.
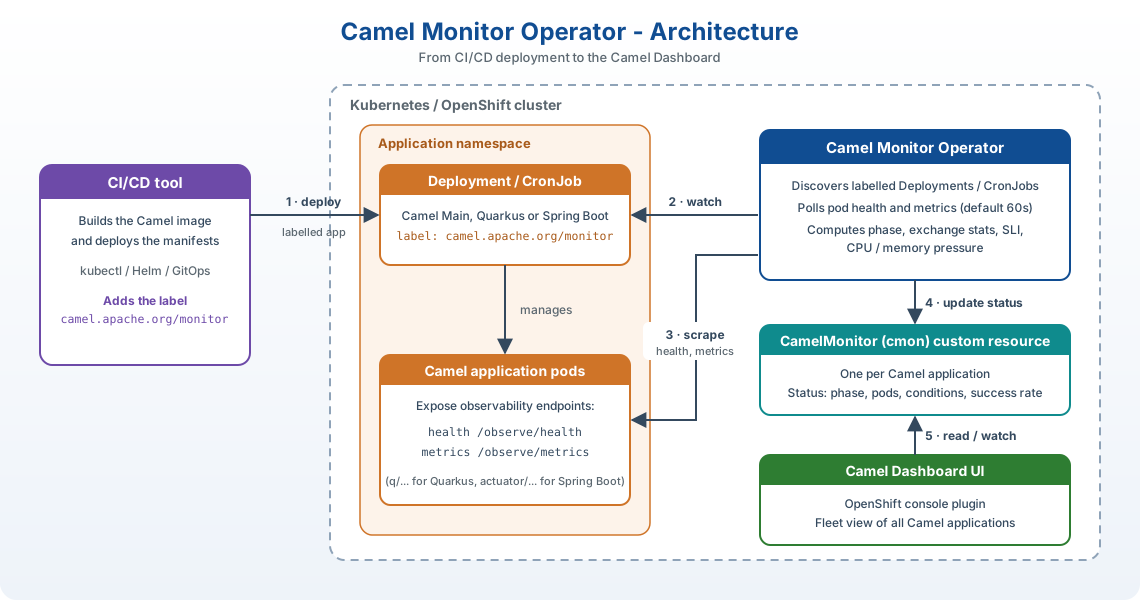
The goal of the Camel Monitor operator is to discover Camel applications (via camel.apache.org/monitor label). Then the operator periodically collects health and metrics information and stores them into a CamelMonitor custom resource. The user can read the information just getting these custom resource or let any other application or agent (AI agent) read them. We also support a GUI when the application is running on Openshift: Camel Dashboard plugin.
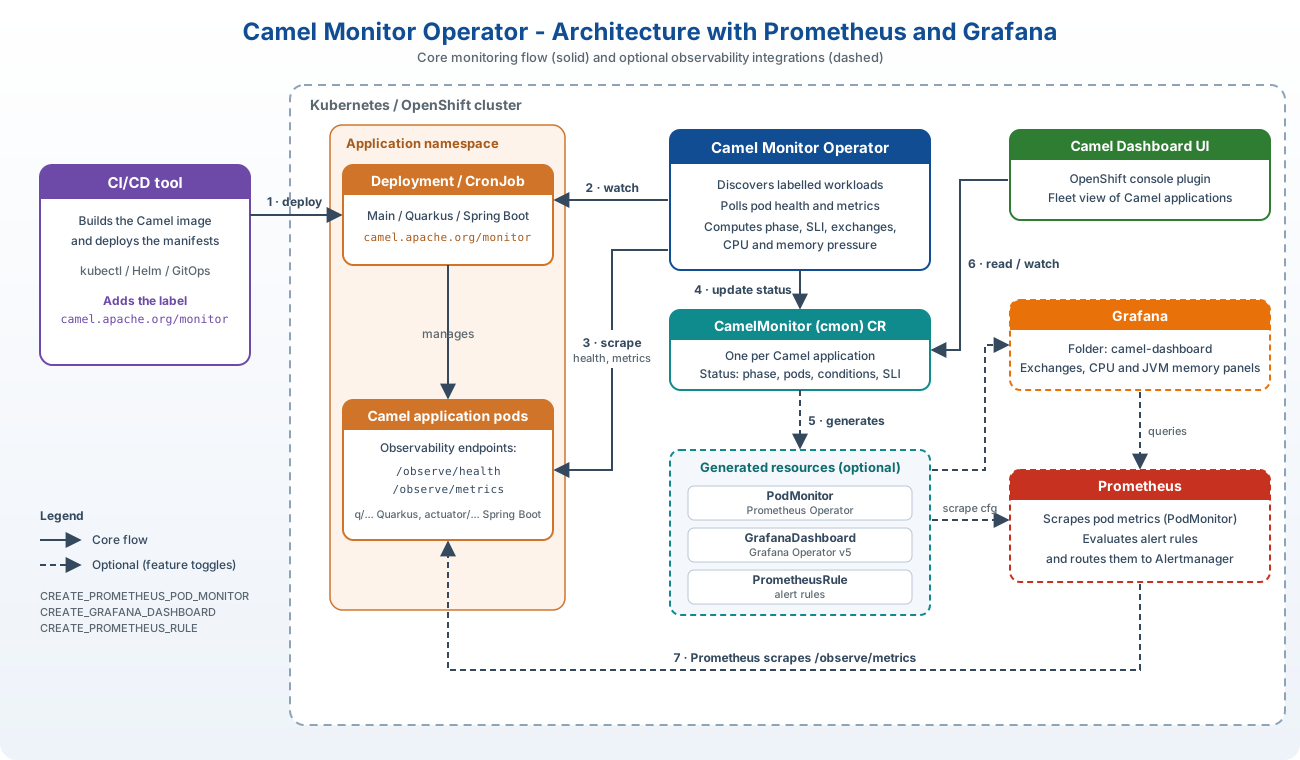
There is also the possibility to automatically let the operator configure most of the Prometheus stack resources. When certain configuration is enabled (see configuration section), the operator will automatically create PodMonitor, GrafanaDashboard and PrometheusRule as you can see in the diagram: