Tooling for Apache Camel K by Red Hat
![]()
This is the support for Apache Camel K functionality for Visual Studio Code
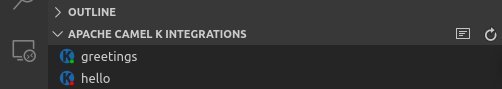
Viewing the status of published integrations
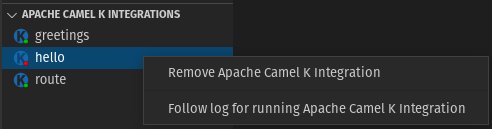
After you publish a new integration, it appears in the Apache Camel K Integrations view in the Side Bar of the Explorer activity:
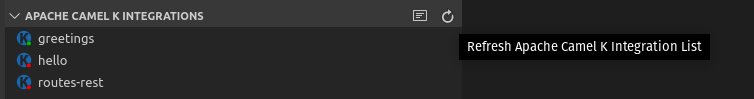
When you add or remove file-based integrations in the Explorer view, it automatically refreshes the list. Note: Refreshing the view sometimes is delayed as pods start. You might need to wait a few seconds. Optionally, to manually refresh the list, click the Refresh button.
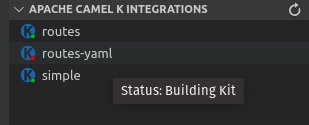
The status of deployment for Integrations is indicated by the color of the dot in the K icon for the integration. If green, the integration is in a “Running” state. If red, it is in another state, such as “Building Kit” or “Error”. Hover over the integration to view a tooltip that shows the status:
The Tooling for Apache Camel K extension shows a status bar message for the following events:
- Starting a new integration
- Removing an integration
- Refreshing the integrations view
- Starting to follow an integration log
- Starting a local Kubernetes proxy instance
Optionally, to disable status bar messages:
- From the VS Code IDE, select File > Preferences > Settings.
- Select Extensions and then select Apache Camel K Tooling Extension Settings.
- Uncheck the Show Status Bar Messages option.
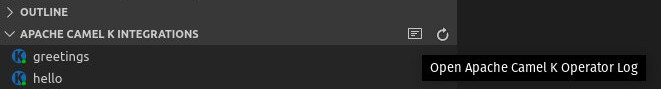
Viewing the log for an Apache Camel K Operator
In the background of each Apache Camel K system, there is an Operator coordinating the various builders and integrations being spun up. This log will often contain information not found in the integration log, including kit builder details. (See Viewing the running log below for details on opening the integration log.)
A new editor view opens. It is named for the running Kubernetes pod where the Operator is running. This log updates as new data is added.
Viewing the running log for a published Apache Camel K Integration
If you are running an integration in Dev mode, you can view the logged output for that integration in the Apache Camel K Output channel.
If you want to explicitly view the running log for a published integration in a new Log view, right-click on a running integration and then select the Follow log for running Apache Camel K Integration option.
A new editor view opens. It is named for the running Kubernetes pod where the integration is running. This log updates as new data is added:
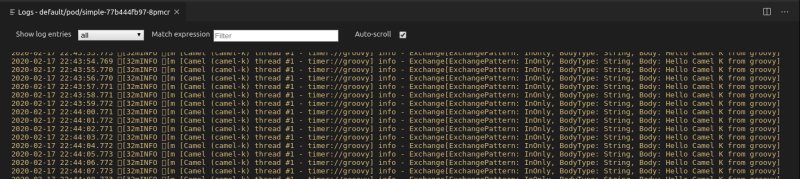
Note: By default, Auto-scroll is checked and new entries in the log will automatically be scrolled to the bottom of the window. If turned off, the scrolling stops and can be done manually.